
Your Customer Experience Journey Map Is Probably a Work of Fiction
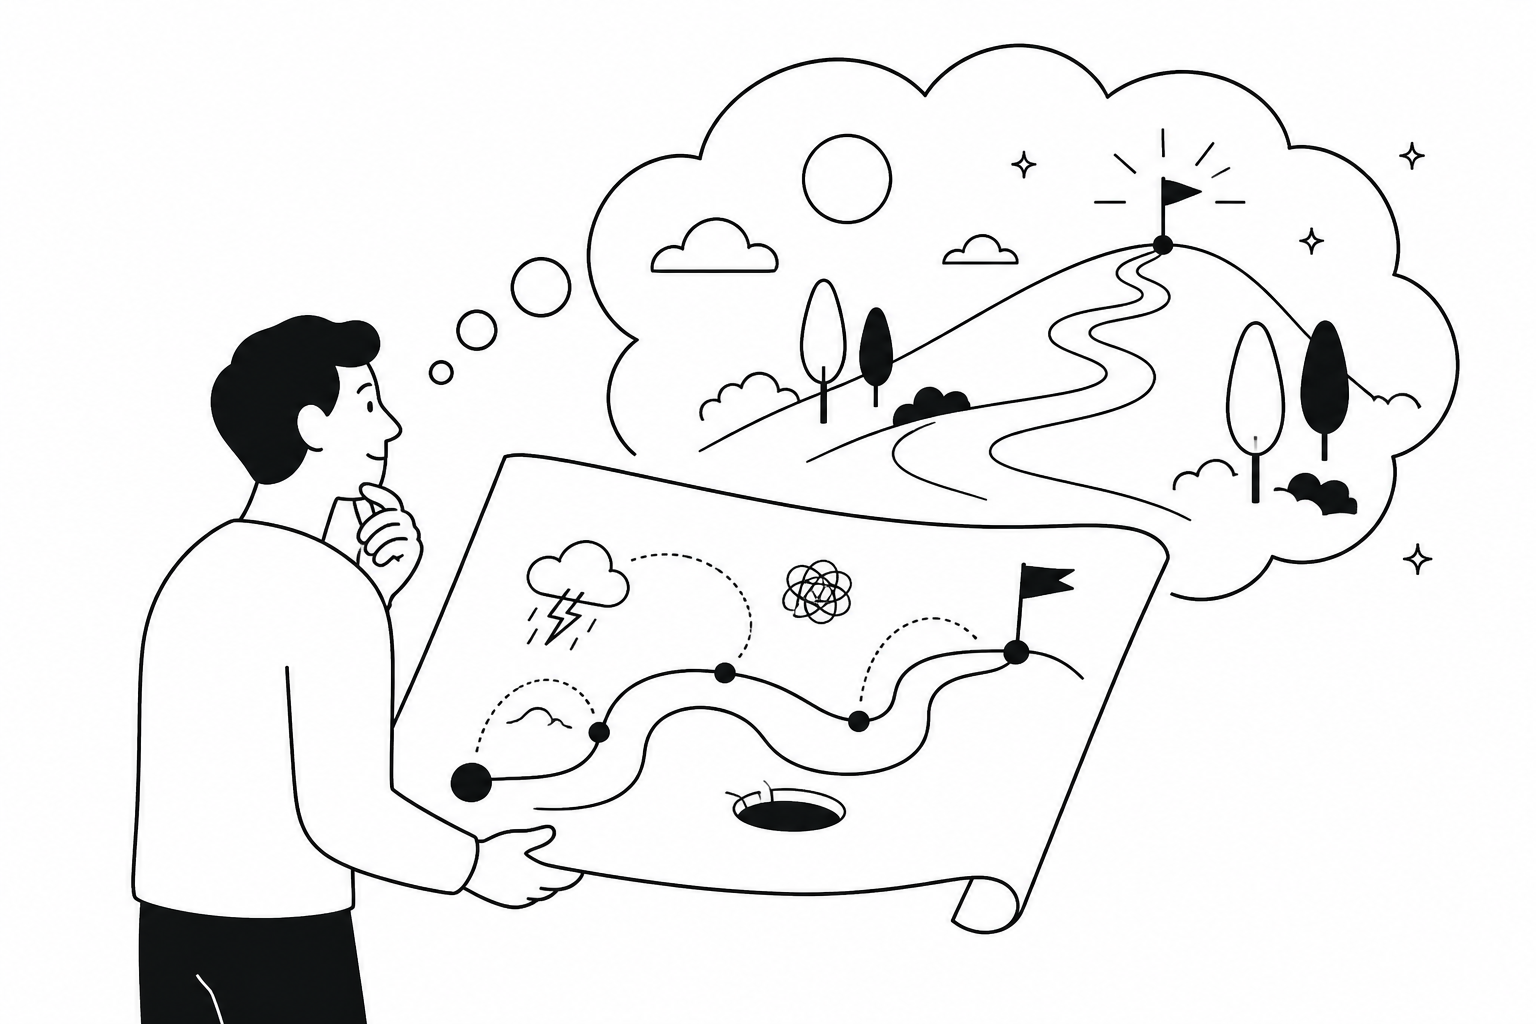
I've sat in more journey mapping workshops than I can count. Sticky notes on a wall, a facilitator drawing a tidy line from "Awareness" to "Loyalty," and a room full of stakeholders nodding along because the map looks clean and logical. Then three months later, churn hasn't moved, support tickets haven't dropped, and nobody can explain why. The map was never wrong on paper. It was wrong because nobody actually talked to customers before drawing it.
This is the core problem with how most companies approach the customer experience journey. They build it from internal assumptions, funnel data, and a handful of NPS comments, then treat it as gospel. A real journey is messy, nonlinear, and full of moments that never show up in your analytics dashboard. If you want a journey map that actually changes outcomes, you need to build it from what customers say, not what your team assumes they feel.
Why Most Journey Maps Fail Before They're Even Finished
The biggest mistake I see is treating the journey map as a design exercise instead of a research deliverable. Teams start with a template, fill in generic stages, and back into "insights" that confirm whatever story leadership already believes. I worked with a subscription ecommerce brand that swore their biggest drop-off was at checkout. Their map said so. Six months of checkout optimization later, conversion barely moved. When we finally ran structured interviews with recent cancellers, the real issue was three weeks earlier, in a confusing onboarding email that made customers think their first shipment had already failed. The map pointed everyone at the wrong stage entirely.
This happens constantly because most mapping exercises skip the step where you actually validate emotional and behavioral friction with real conversations. I go deeper into why this keeps happening and how to fix the underlying process in this breakdown of why customer experience journey mapping is broken. The short version: if your map wasn't built from recent, specific customer conversations, it's a guess with good design.
Your Analytics Are Telling You a Story, Not the Truth
Quantitative CX data is seductive because it feels objective. Drop-off rates, time on page, ticket volume, all clean numbers you can put in a slide. But numbers tell you where something happened, not why. I've seen teams stare at a funnel chart for weeks trying to explain a 12% drop at a single step, when a single afternoon of interviews would have surfaced the actual reason in the first five conversations. A B2B software client of mine had a support ticket spike every single month around the same date. Their assumption was a billing bug. It wasn't a bug. It was renewal anxiety triggered by an unclear invoice email that customers read as a price increase. No dashboard was ever going to tell them that. Only hearing customers describe their confusion in their own words got them there.
I wrote a full piece on this pattern, because it shows up in nearly every CX program I've reviewed. If you're relying on dashboards alone to explain drop-off, churn, or non-conversion, you're missing the actual cause almost every time. Here's the deeper argument for why customer experience analysis is lying to you and what to do instead.
Service Journeys Have Hidden Breakpoints Your Ticket Tags Never Catch
Support and service journeys are where I see the widest gap between what companies think is happening and what's actually happening. Ticket categorization systems are built for triage, not insight. A ticket tagged "billing question" might actually be a symptom of a confusing pricing page, a missed onboarding step, or a feature that quietly broke three releases ago. The tag tells you the topic. It never tells you the root cause. I once audited a company's "top 10 ticket categories" report expecting to find product bugs. Instead, the real driver behind four of their top categories was a single unclear settings screen that customers kept misreading in four different ways. No one had noticed because each misread generated a differently worded ticket.
This is exactly the kind of hidden breakpoint that repeat contacts and churn hide behind, and it's why I always push teams to combine service data with structured voice interviews before they redesign anything. I unpack how to actually find these breakpoints in this piece on customer service journeys and hidden breakpoints.
Client Experience Journeys Fail for the Same Reason B2B Sales Journeys Fail
If you work in B2B, agency, or professional services, you've probably built a "client experience journey" that looks suspiciously like a project timeline with feelings bolted on. Kickoff, onboarding, delivery, renewal. It's tidy, but it rarely captures the actual emotional arc of the client relationship, which is where churn and referral decisions actually get made. I consulted for a mid-size agency that had an immaculate client journey deck. Beautiful stages, clear milestones. But when we interviewed clients who didn't renew, almost none of them described their experience along those stages. They talked about specific moments: a slow response to one email, a account manager change that nobody explained, a deliverable that felt generic. None of that showed up on the official map because the map was built around internal process, not the client's actual lived experience.
The fix isn't a prettier map. It's building the map around what clients actually say drives their trust and frustration, which I go into in detail in this piece on why client experience journeys fail and how to fix yours.
The Research-Driven Fix for Broken Service Journeys
Once you accept that ticket data and NPS scores won't reveal the real friction points, the question becomes: what do you actually do instead? The answer isn't "run more surveys." Surveys tell you that something is wrong at a 6.2 out of 10. They almost never tell you what, specifically, is wrong or why a customer feels that way. The fix I've used successfully across dozens of engagements is structured, recurring qualitative interviews tied directly to service touchpoints. Not annual research projects. Continuous, lightweight conversations that happen close to the moment of friction, while the customer still remembers the specific details. When we shifted a fintech client from quarterly surveys to interviews triggered right after a support interaction, the specificity of what we learned jumped immediately. Customers stopped saying "the support was slow" and started saying exactly which step made them anxious and why.
I lay out the full research-driven approach, including how to sequence interviews around service touchpoints, in this guide to why customer service journeys fail and the fix that actually works.
What Top Retail Brands Measure That Everyone Else Ignores
Retail is a great case study because the physical environment adds a whole layer of experience that digital-only teams never have to think about. Most retail CX programs measure foot traffic, conversion rate, and basket size. Useful numbers, but they miss almost everything about how a customer actually feels moving through a store. The retail brands I've seen do this well measure things like decision fatigue at specific fixtures, staff interaction quality at the exact moment a customer is comparing products, and the emotional tone of a customer's internal monologue when they can't find what they came for. None of that comes from POS data. It comes from intercepting customers in the moment or running structured recall interviews shortly after their visit.
| What Most Retailers Measure | What Leading Retailers Also Measure |
|---|---|
| Foot traffic and dwell time | Decision fatigue at specific fixtures or displays |
| Conversion rate per visit | Emotional tone during product comparison moments |
| Basket size | Confidence level at the point of purchase decision |
| Return rate | Specific reason customer almost didn't buy |
| NPS or satisfaction score | Staff interaction quality at the exact friction point |
If you're in retail CX and only tracking the left column, you're optimizing a store that looks fine on paper while missing the actual reasons customers hesitate, abandon, or leave frustrated. I go deeper on this gap in this piece on why retail store experience is failing and what top brands measure instead.
Rebuilding the Map So It Actually Drives Conversions
After all this, the practical question is: how do you build a customer experience journey map that's actually useful instead of decorative? Here's the process I use with every client now. First, throw out the assumption that a journey map is a one-time deliverable. It's a living document that needs fresh input every quarter at minimum, because customer behavior and expectations shift faster than most teams update their maps. Second, build every stage from actual customer language, not internal terminology. If your map says "Consideration" but customers describe that stage as "trying to figure out if this is a scam or not," your map should say that instead. The gap between internal language and customer language is usually where the real insight lives. Third, tie every friction point on the map to a specific, sourced quote or interview finding. If you can't point to where a friction point came from, it's an assumption dressed up as an insight, and it will lead your team in the wrong direction just like the checkout example earlier. Fourth, prioritize ruthlessly. Every workshop I've run generates twenty potential friction points. Maybe three actually move revenue or retention. Use follow-up interviews to test which friction points customers describe as truly decision-changing versus mildly annoying.
I walk through this full rebuild process, including how to identify which friction points are actually costing you conversions versus which ones just feel important in a meeting, in this guide to why your customer experience journey map is wrong and what actually drives conversions.
What This Means for Your Next Journey Mapping Project
The pattern across every example here is the same. Teams build customer experience journeys from internal data, internal assumptions, or internal language, then wonder why the map doesn't predict real behavior. The fix isn't more sophisticated analytics or a fancier mapping tool. It's structured, recurring conversations with real customers, close to the moments that matter, analyzed for specific themes rather than vague sentiment. The problem has always been that this kind of research is expensive and slow when you run it the traditional way. Recruiting participants, scheduling interviews, transcribing, coding themes by hand. Most teams skip it entirely and default to the survey-and-dashboard approach because it's faster, even though it's less accurate.
That's the exact gap Usercall is built to close. Usercall runs AI-moderated voice interviews at scale, so you can talk to dozens or hundreds of customers about their actual journey, at the moments that matter, without the cost and timeline of traditional research. It automatically links themes to the specific quotes that support them, so when you rebuild your journey map, every friction point is backed by real customer language instead of a guess from a workshop. If your current map was built without that kind of evidence, it's time to rebuild it with some.